

Ultimate guide to trading indices CFDs
Learn the basics of trading indices CFDs, including what they are, how they work, and why traders love them.
* Trading is risky. Your capital is at risk.
Indices CFDs let you trade the price movement of a whole stock market index like the FTSE 100, the S&P 500, and the DAX without buying a single share in any company inside it.
That's the whole idea. One position, hundreds of companies, one price.
This guide covers what an index actually is, how a CFD tracks it, the costs involved (spread, overnight financing, corporate action adjustments), the difference between cash and futures indices, and how margin works when you're trading one.
By the end, you'll know how to open your first indices CFD position, what to check before you do, and where new traders lose money without realising it.
Key takeaways
Indices CFDs are a quick, convenient, and cost-effective way to trade an overall market
Indices CFDs are ideal for diversification and risk distribution offering exposure to a range of assets across a specific sector or an entire economy in a single trade
You can enter both ‘long’ (buy) and ‘short’ (sell) positions to maximise opportunities for returns
Margin and leverage in indices CFD trading mean you need less capital for large trades but need to be aware of the risks
What are indices CFDs?
To define indices CFDs, let us first consider their two parts individually: indices and CFDs.
Indices
Indices, also known as indexes, are financial instruments that represent a collection or portfolio of related assets, such as stocks from various companies.
Imagine an index as a virtual basket that holds a variety of assets rather than relying on just one specific asset. Instead of following the performance of a single company's stock, the index "tracks" or measures the overall performance of the entire group of assets it represents.
The assets are grouped together based on certain criteria such as prominent national companies, a specific sector or an entire economy. For example, the well-known S&P 500 (US500) comprises 500 of the largest companies listed on US stock exchanges.
Mini indices provide the same exposure as the main index but offer smaller lot sizes, so they cost less than their 'major' counterparts. Minis are a great option for new or cautious traders to 'test the waters' of trading indices CFDs with less capital.
It's easy to spot a mini index with FXTM, as they have an '_m' at the end of their name. For example, the mini version for the S&P 500 is US500_m.
CFDs
CFD is the abbreviation for Contract for Difference, a form of derivative trading. A derivative is a financial contract between two parties that takes its value from the price of an underlying asset, like the indices.
Essentially, a CFD allows you to speculate and potentially profit from changes in the asset’s price - both increases and decreases, depending on your position - without owning the asset itself.
Indices CFDs are a form of derivative trading specifically for indices, which track the overall performance of a collection of stocks and not an individual asset or commodity.
How are indices weighted and valued?
The value of an index is calculated based on its weighting.
The type of weighting is usually determined by the index’s managing company. Two weighting methodologies commonly used are price and capitalisation. Let’s start with price.
Price weighted index
In a price-weighted index, each company's stock is weighted by its price per share, and the index value is an average of the share prices of all the companies. The higher the price of a stock, the greater the weighting of that stock within the index.
For example, let’s imagine there’s a stock index called ABC Index and it’s comprised of 5 companies with the following names and share prices.
To calculate the index value, we add all the share prices together and divide by the number of companies included in the index.
Because Company B has the highest share price, it has a greater weighting than Company A and Company C. This means that any movement in the share price of Company B will have a greater impact on the overall index value than changes in the share prices of Company A or Company C.
The Dow Jones and the Nikkei are examples of price-weighted indices.
Price weighted index example
| Name | Share Price | Weighting of Total Index |
|---|---|---|
Company A | $10 | 5% ($10/200) |
Company B | $90 | 45% ($90/200) |
Company C | $20 | 10% ($20/200) |
Company D | $20 | 10% ($20/200) |
Company E | $60 | 30% ($60/200) |
Index value | $40 | ($10 + $90+ $20 + $20 + $60)/5 |
To define indices CFDs, let us first consider their two parts individually: indices and CFDs.
Indices
Indices, also known as indexes, are financial instruments that represent a collection or portfolio of related assets, such as stocks from various companies. Imagine an index as a virtual basket that holds a variety of assets rather than relying on just one specific asset. Instead of following the performance of a single company's stock, the index "tracks" or measures the overall performance of the entire group of assets it represents. The assets are grouped together based on certain criteria such as prominent national companies, a specific sector or an entire economy. For example, the well-known S&P 500 (US500) comprises 500 of the largest companies listed on US stock exchanges.
Mini indices provide the same exposure as the main index but offer smaller lot sizes, so they cost less than their 'major' counterparts. Minis are a great option for new or cautious traders to 'test the waters' of trading indices CFDs with less capital. It's easy to spot a mini index with FXTM, as they have an '_m' at the end of their name. For example, the mini version for the S&P 500 is US500_m.
CFDs
CFD is the abbreviation for Contract for Difference, a form of derivative trading. A derivative is a financial contract between two parties that takes its value from the price of an underlying asset, like the indices.
Essentially, a CFD allows you to speculate and potentially profit from changes in the asset’s price - both increases and decreases, depending on your position - without owning the asset itself.
Indices CFDs are a form of derivative trading specifically for indices, which track the overall performance of a collection of stocks and not an individual asset or commodity.
Capital weighted index example
| Name | Share Price | Outstanding Shares | Market Cap | Weighting of Total Index |
|---|---|---|---|---|
Company A | $10 | 12,500 | $125,000 | 12.5% (125,000/1,000,000) |
Company B | $90 | 2,500 | $225,000 | 22.5% (225,000/1,000,000) |
Company C | $20 | 12,500 | $250,000 | 25% (250,000/1,000,000) |
Company D | $20 | 9,500 | $190,000 | 19% (190,000/1,000,000) |
Company E | $60 | 3,500 | $210,000 | 21% (210,000/1,000,000) |
Index value | $1,000,000 |
Benefits of trading indices CFDs
Flexibility
Arguably one of the primary benefits of trading indices CFDs is the ability to profit from both rising and falling markets.
With CFDs, you can take long (buy) or short (sell) positions, allowing you to potentially benefit from both upward and downward price movement.
Whatever direction the markets are heading, CFD indices always provide opportunity.
Leverage and margin
A key advantage of trading CFDs is that you only need to deposit a small percentage of the total trade value, known as margin.
Unlike traditional stock trading, where you’d need to own the physical shares, CFDs allow you to speculate on indices without owning the underlying assets.
Using margin gives you greater exposure to the market because profits and losses will be calculated based on the full position size, not only the funds used as margin.
Let’s say you wanted to buy $100 worth of stocks. Typically, you’d have to pay $100 for the asset. But if you had a leverage of 10:1, for example, you’d only have to place 10% of your total trade value down as capital, in this case being $10. So, you still have the advantage of the higher trade value, but with less capital required.
Leverage is higher with indices CFDs than with traditional trading
Using a smaller portion of your capital when opening a position allows for potentially greater returns. The crucial aspect to remember is that leverage carries equal risk to amplify losses. As such, it’s essential to understand the risks of margin and leverage and apply effective risk management strategies to prevent significant losses.
Diversification
Indices CFDs provide access to a wide range of assets representing different sectors, multiple companies or countries in a single trade. This allows traders to diversify their investments across various markets and industries, potentially mitigating the impact of any single company's underperformance on their overall portfolio.
Hedging
Trading indices CFDs can be used as a hedging strategy to offset potential losses in an existing portfolio. For example, if you have a portfolio heavily weighted in specific sectors, you can take a short position on the corresponding index CFDs to hedge against potential downturns.
Lower costs and fees
Trading indices CFDs eliminates certain costs associated with traditional stock trading, such as stamp duty or stock exchange fees. This cost advantage makes indices CFDs a cost-effective option for traders looking to participate in the performance of stock market indices.
Liquidity
Major indices tend to have high liquidity, meaning there is usually a significant volume of buyers and sellers in the market. This ensures that traders can enter and exit positions quickly at competitive prices without worrying about liquidity constraints.

Risks of trading indices CFDs
Potential for increased losses
While indices CFDs offer higher leverage than traditional financial instruments, helping to boost potential returns, they have the same capacity to amplify losses. The markets can also be fast-paced and volatile. In some instances, this would mean the need for a margin call, or adding funds, to maintain your position.
Spread payments
Although trading indices CFDs spares you from many of the costs of traditional trading, you are required to pay the costs of spreads at entry and exit positions. This means that it’s potentially more difficult to make small profits.
Swap costs
You may also need to factor in swaps – the cost of keeping your trade open overnight. If you enter a long position (i.e. you buy expecting the market to rise), you will need to pay a small amount of interest every night to keep your trade open. Remember to factor in the cost of the spreads and swaps when calculating profits or losses.
How do indices CFDs work?
You cannot buy the index directly, so you trade a product that tracks it. For a beginner, three routes matter. They differ in cost, complexity, and how much money you need to start.
Index funds and ETFs: owning the market
An S&P 500 ETF is a fund that holds all 500 stocks and trades like a single share. You buy it, you own a slice of the index, and you profit if it rises. It is simple, cheap to hold, and the standard choice for long-term investing rather than active trading. The catch for a trader: you only make money when the index goes up, you need the full value of what you buy, and you cannot easily profit from a falling market.
Futures: the professional route
S&P 500 futures are contracts to trade the index at a set price on a future date. They are highly liquid and trade nearly around the clock, which is why professionals use them. They are also large, complex, and unforgiving for beginners. Contract sizes and margin requirements are steep, and a small mistake gets expensive fast. This is not where most people should start.
CFDs: the flexible route for active traders
A CFD, or contract for difference, lets you trade on the index's price movement without owning anything.
You can go long if you think it will rise or short if you think it will fall. You put down a fraction of the position's value as margin, which means a smaller account can trade a meaningful position. That flexibility is why CFDs are the most relevant route for active retail traders, and it is what the next section covers in full.
Calculating contract profit or loss
This is the route most active retail traders use, so it is worth understanding properly before you risk a cent. A CFD is simple in principle and easy to misuse in practice. Get the mechanics right and the rest follows.
What a CFD actually is
A contract for difference is an agreement between you and your broker to exchange the difference in the index's price between the moment you open the trade and the moment you close it.
If you open a long position at 7,500 and close it at 7,600, the broker pays you the 100-point difference, multiplied by your position size. If you got the direction wrong and it falls to 7,400, you pay the difference instead. You never own any shares. You are trading the movement, nothing more.
Because you can bet on a fall as easily as a rise, CFDs let you try to profit whether the market goes up or down. That is the main appeal over simply owning a fund.
Going long and going short
Long means you buy first, expecting the price to rise, and sell later to close. Short means you sell first, expecting the price to fall, and buy back later to close.
Shorting confuses beginners because you are selling something you do not own. With a CFD you can, because you are not trading the shares, only the price difference. If the index drops after you short it, you profit. If it rises, you lose. It is the mirror image of going long.
Margin and leverage: the part that makes or breaks you
This is the single most important idea in CFD trading. Get it wrong and nothing else matters.
When you open a CFD, you do not pay the full value of the position. You put down a deposit called margin, and the broker covers the rest. The full position size is your exposure. The margin is just the slice you post to hold it.
For major stock indices, retail margin is commonly around 5%, which corresponds to leverage of about 20 times. Exact figures vary by broker and by regulator. (ESMA)
Leverage is a magnifier. A 5% margin means every 1% the index moves is a 20% move on your deposit. That cuts both ways. A move in your favour is amplified. A move against you is amplified just as hard, and it eats your margin fast.
A worked example: one long trade, start to finish
Numbers make this concrete. The figures below are illustrative and rounded to keep the maths clean. Real spreads, margin rates and financing costs vary by broker, so check yours before trading.
Assume the S&P 500 CFD is priced at the index level, and you trade at $1 per point per contract.
Opening the trade
- You expect the index to rise. You buy 1 contract at 7,500.
- Position size (exposure): 7,500 points x $1 = $7,500.
- Margin at 5%: you only put down $375 to hold that $7,500 position.
- Spread cost: if the broker's spread is 0.4 points, you pay about $0.40 to enter. Small here, but it adds up across many trades.
If the trade goes your way
The index rises to 7,600. That is a 100-point move in your favour.
- Profit: 100 points x $1 = $100.
- Return on your $375 margin: about 27%, from a move of just 1.3% in the index.
That is leverage working for you. A small index move became a large percentage gain on your deposit.
If the trade goes against you
Now run it the other way. The index falls to 7,400. That is a 100-point move against you.
- Loss: 100 points x $1 = $100.
- That is roughly 27% of your margin gone from the same 1.3% index move.
Same size move, same magnifier, opposite result. If the index fell far enough, your loss could exceed the $375 you posted, which is why the next two points matter.
The costs that run in the background
Hold a CFD overnight and you pay a financing charge, often called swap or overnight funding. It is the daily interest cost of the money the broker is effectively lending you to hold a leveraged position, and on a long index position it is usually a charge rather than a credit. (IG)
For a day trade, financing is irrelevant. Hold a position for weeks and it becomes a real cost that quietly eats your profit. Factor it in before you plan to hold anything for more than a day or two.
The protections worth knowing about
Regulated brokers typically offer two safeguards for retail traders. A margin close-out rule automatically closes your positions if your account falls below a set level, often 50% of required margin, before losses run deeper. And negative balance protection caps your loss at the money in your account, so you cannot end up owing the broker more than you deposited.
These are safety nets, not strategies. They stop a disaster from becoming a catastrophe. They do not stop you losing the money in your account. That job is yours, and it is what risk management is for.
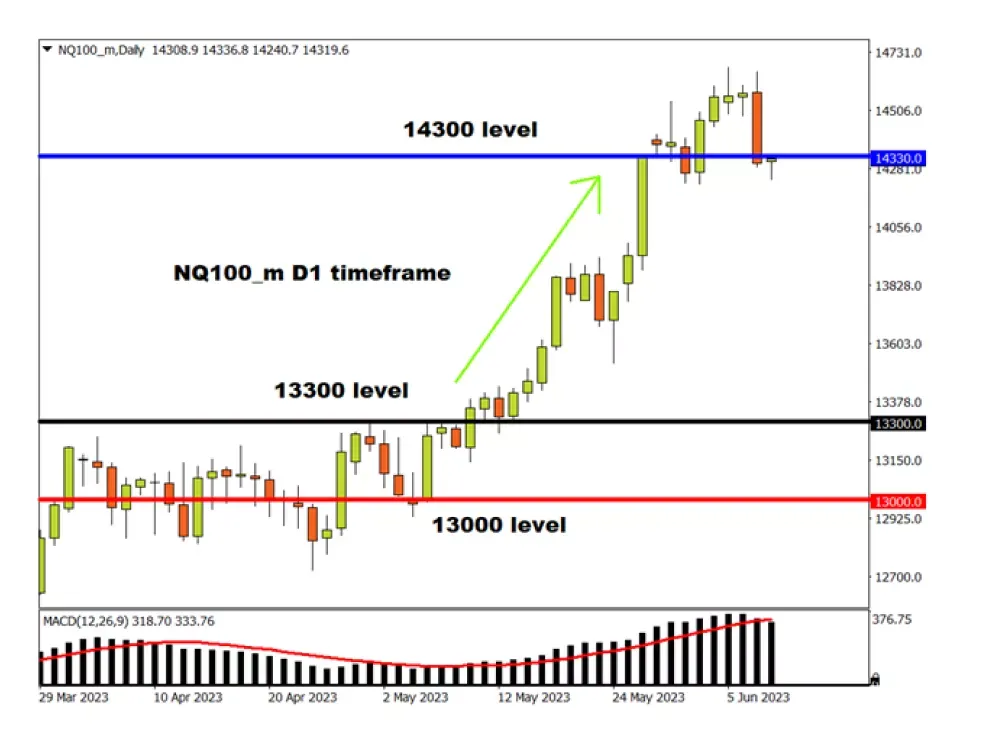
Example of profit in a ‘long’ (buy) trade for the NAS100_m.
What happened:
- Market entered at 13300
- Stop loss set at 13000 (not triggered)
- Take profit triggered at 14300
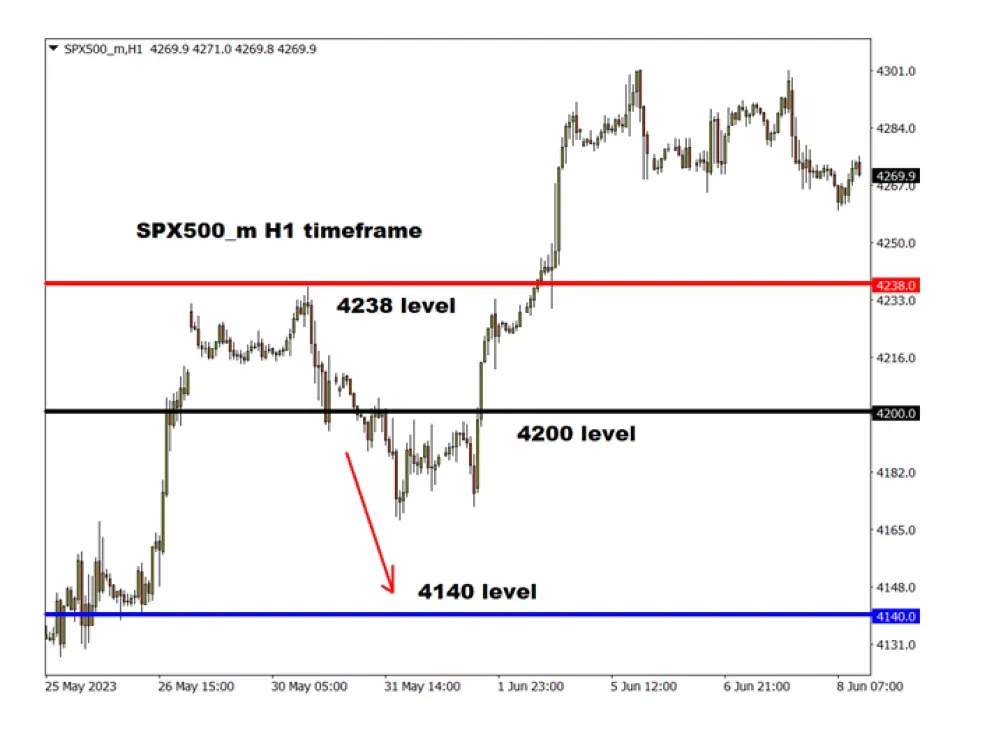
Example of loss result in a ‘short’ (sell) trade for the US500_m.
What happened:
- Market entered at 4200
- Take profit set at 4140 (not triggered)
- Stop loss triggered at 4238
What moves indices markets?
Market sentiment
Investor sentiment and market expectations play a significant role in the price movement of indices CFDs. Positive sentiment can drive prices up, while negative sentiment can lead to declines.
Economic indicators
Economic indicators, such as GDP growth, inflation rates, employment data, and central bank decisions, can impact index prices. Strong economic data may lead to higher index prices, indicating a robust economy, while weak data may result in lower prices.
You can see a comprehensive list of upcoming events and data releases using the FXTM economic calendar.
Corporate earnings
The financial performance of companies within the index can affect the index price. Positive earnings reports and outlooks from constituent companies often lead to index gains, while disappointing earnings can cause declines.
Interest rates
Changes in interest rates set by central banks can impact index prices. Lower interest rates generally encourage investment and can drive index prices higher, while higher rates can have the opposite effect.
Geopolitical events
Geopolitical developments, such as trade wars, political instability, or international conflicts, can create volatility in the markets and affect index prices. Uncertainty and negative news can lead to price declines, while positive resolutions can have the opposite effect.
Market liquidity
The level of liquidity in the market, including trading volumes and spreads, can influence index prices. Higher liquidity generally leads to smoother price movements, while lower liquidity can result in more significant price swings and volatility.
Sector-specific factors
Specific sectors within an index can experience unique factors that influence their performance. For example, regulatory changes, technological advancements, or supply and demand dynamics can impact certain sectors, affecting the overall index price.
Key indicators for trading indices
Support and resistance
Developing the skills to identify potential support and resistance levels is a key skill that you learn in technical analysis. Both represent levels where the price seems to rise and fall to, but never surpass.
The typical strategy for trading with support and resistance is to buy when the price during an uptrend falls to the support line. The trader anticipates a bounce back towards the upward direction. Alternatively, during a downtrend, the trader sells when the price reaches the resistance level in anticipation that the index will trend downwards.
Trading the trend (trend lines)
Trendline trading is particularly useful when trading stock indices as CFDs. For instance, an index such as S&P 500 trends up over the long run.
Over time economies keep expanding. Companies innovate and embrace new technologies, which leads to long-term growth. Share prices keep rising.
There are various ways of identifying trends, such as plotting high lows and low highs or using various indicators like the Moving average and the momentum indicator.
Moving averages
Using moving averages to trade indices helps you pinpoint the overall trend of the market without the noise of day-to-day price movements.
Moving averages can be defined as lines that are based on the average closing price over a given time frame.
There are various popular time frames used for moving averages, including 10 days, 20 days, or 50 days. The moving average provides support and resistance levels. For instance, during an upward trend in the market, the price tends to bounce upwards after testing the moving average.
Stochastic oscillators
Another simple and effective indicator to apply when trading Indices is the stochastic indicator. It's a simple tool for beginners because it entails two lines: %K and %D.
It's fundamentally used to determine if the market has been overbought or oversold.
Traders mainly look at the %D for trading signals. It's called an oscillator because the lines oscillate (move up and down) with the price movement.
There are two types of stochastic oscillators: fast and slow. The fast stochastic oscillator tends to produce more false signals as it's more susceptible to noise.
By tweaking the formula, the slow stochastic was introduced, and it smooths out the price action to produce better signals.
Common beginner mistakes
Most beginners lose money the same handful of ways. Knowing them in advance is half the battle.
- Overleveraging. Trading the biggest position the margin allows, so one normal move against you does serious damage.
- Trading without a stop-loss. Hoping a losing trade recovers instead of accepting a small, planned loss.
- Revenge trading. Taking a bigger, worse trade straight after a loss to "win it back". This is how a bad day becomes a bad month.
- Ignoring costs. Forgetting that spreads and overnight financing quietly erode returns, especially on positions held for days.
- No plan. Trading on feeling, tips, or a finfluencer's screenshot, with no rule for when to enter, exit, or walk away.
- None of these are about intelligence. They are about discipline. The market punishes the same lapses in everyone.
What indices can I trade with FXTM?
Beginners think trading is about being right. It is not. It is about surviving being wrong, because you will be wrong often. The traders who last are not the ones who pick the most winners. They are the ones who lose small when they are wrong.
Here are a few tips for how you can protect yourself.
Risk a fixed, small slice per trade
The core rule: never risk more than 1% to 2% of your account on a single trade. On a $2,000 account, that is $20 to $40 of risk per trade. It sounds too cautious to a beginner who wants fast gains. It is exactly why experienced traders are still trading and most beginners are not. A run of losses cannot wipe you out if each loss is tiny.
Always use a stop-loss
A stop-loss is an order that closes your trade automatically if the price hits a level you set in advance. You decide your maximum loss before you enter, not in the panic of watching it fall.
Without a stop, a losing trade has no floor. Traders talk themselves into holding, sure it will come back, and a small loss becomes an account-ending one. The stop takes that decision out of your hands. Set it when you open the trade, every time.
Size your position from your stop, not your hope
Position sizing ties the last two rules together. Once you know how much you will risk and where your stop sits, the size of your trade is a calculation, not a feeling.
- Decide your risk in money. On a $2,000 account risking 1%, that is $20.
- Measure your stop distance in points. Say you will exit if the index moves 40 points against you.
- Size so that 40 points equals $20. At $1 per point that is too big, so you trade a smaller size, for example $0.50 per point, making your risk $20.
Do this and every trade risks the same small amount, no matter how far away your stop is. That consistency is what a trading plan is made of.
Respect leverage instead of chasing it
High leverage is sold as opportunity. Treat it as a risk to be managed. The fact that you can control a $7,500 position with $375 does not mean you should max it out. Trade smaller than you are allowed to. The traders who survive their first year are almost always the ones who used far less leverage than their broker offered.
| Index | Symbol | Description |
|---|---|---|
AXS 200 | AU200 | The AU200 index is the blue-chip Australian stock market index, which tracks the value of 200 of Australia’s largest public companies by market capitalisation. |
CAC 40 | FRA40 | The CAC 40 tracks 40 of the most significant securities listed on the Euronext Paris. This index indicates the health of the Paris stock market and follows a cap-weighted scheme. |
Hang Seng | HK50 | Hang Seng China 50 index constituents include the top companies from Hong Kong’s stock exchange. It’s one of the major stocks indices in Asia and is cap-weighted. |
Nikkei | JP225 | The Nikkei is composed of 225 large Japanese blue-chip companies and serves as the top indicator of the Japanese stock market. It’s weighted by price. |
Ibex 35 | SPN35 | The Spain 35 index acts as a benchmark for Spain's main stock exchange. It follows a capitalisation-weighted scheme and includes 35 of the top publicly traded companies. |
EuroStoxx 50 | EU50 | EuroStoxx 50 comprises Eurozone stocks from 9 countries but is mainly dominated by French and German companies. Stocks featured are of blue-chip market leaders in key sub-sectors. |
FTSE 100 | UK100 | The FTSE 100 is one of the most popular indices to trade. The cap-weighted index includes shares of 100 large companies featured on the London Stock Exchange. It reflects more than 80 percent of the UK's market capitalisation and is the most regarded benchmark. |
Nasdaq 100 | NAS100 | The Nasdaq 100 index offers the CFD option of the NASDAQ-100 Index from the Nasdaq Stock Exchange, which includes 100 non-financial companies in sectors such as technology, telecom, and biotech. |
China A50 | CN50 | The China A50 index comprises the largest 50 A Share companies by full market capitalisation of the securities listed on the Shanghai and Shenzhen stock exchanges. |
S&P 500 | US500 | The US500 index consists of large-cap U.S. stocks, reflecting the American economy across all sectors. It highlights blue-chip market leaders representing various industries nationwide. |
Dow Jones Industrial | US30 | The Wall Street 30, an index, mirroring the renowned Dow Jones Industrial Average index, which comprises 30 prominent companies listed on stock exchanges in the United States. |
DAX 40 | GER40 | An index reflecting the DAX, an index comprising 40 major German blue-chip companies trading on the Frankfurt Stock Exchange. |
Open a trading account
In three easy steps
The bottom line
Indices CFDs give you a quick, flexible route into the markets. You can trade rising and falling prices, spread your exposure across many companies in one position, and do it all without the higher costs of traditional share trading.
That flexibility comes with responsibility. Leverage magnifies your losses just as fast as your gains, so a solid risk management plan is essential. Risk only a small slice of your account per trade, always use a stop-loss, and never trade with more leverage than you can handle.
The smartest first step is to practise before you commit real money. Open a demo account with FXTM today and trade indices CFDs in real market conditions, with zero risk to your capital.
Frequently asked questions
An index measures the collective price performance of a group of shares, usually from a particular country. Indices are often used to track and compare the performance of stock markets.
The performance of each index is dictated by the performance of the underlying share prices that make up that index.
An index is constructed and calculated independently, sometimes by a bank or by a specialist index provider like the FTSE Group. The choice of the companies included in the index is determined by index calculation rules or by a committee. Not all indices use the same rules, however.
By using a CFD, or contract for difference, for indices trading, traders can profit from whenever prices either rise or fall.
Traders can accomplish this by either opening a short (sell) or long (buy) position, depending on whether they think the index will fall or rise, respectively.