

Ultimate guide to trading the S&P 500
Learn what this index is, how it has performed and some strategies for trading it.
* Trading is risky. Your capital is at risk.
The S&P 500 is the most watched number in finance. When the news says "stocks were up today", this is usually the index they mean. It tracks 500 of the largest companies listed in the United States, and for a beginner trader, it is one of the clearest places to start.
This guide explains what it is, how it's built, how people trade it, and how you can get started yourself step by step..
By the end you will understand what the S&P 500 measures, the difference between owning it and trading it, how trading it as a CFD works with a full worked example, a handful of beginner strategies, and the risk rules that keep you in the game.
Key takeaways
The S&P 500 tracks 500 large US companies and covers around 80% of the total US stock market value, but you can't buy it directly
The top 10 companies make up roughly 39% of the index, so it behaves more like a technology bet than a truly diversified basket
You can trade the index through ETFs, futures or CFDs, but CFDs let you go long or short with margin, making them the most flexible route for active retail traders
Manage your risk just 1–2% per trade, always set a stop-loss, size your position from that stop, and use far less leverage than your broker allows
What is the S&P 500?
In 1957, Standard & Poor's launched an index designed to measure the broad US stock market in a single number. It picked 500 large companies and tracked their combined value. That index is the S&P 500, and today it covers roughly 80% of the total value of the US stock market.
Think of it as a basket. Instead of following one company, the index follows 500 at once. When most of those companies gain value, the index rises. When most fall, it drops. It is a thermometer for corporate America.
One point of confusion for beginners. The S&P 500 is a measurement, not a share. You cannot walk into a shop and buy "one S&P 500" the way you buy a share of Apple. What you buy is a product that tracks the index: a fund, a futures contract, or a CFD. More on those later.
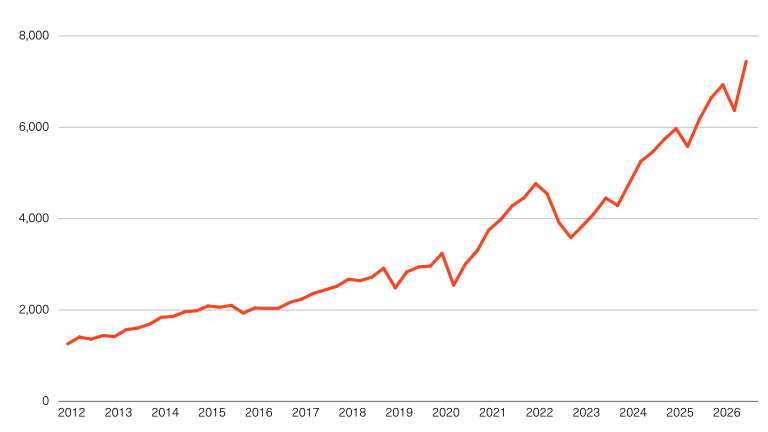
The number you see quoted, around 7,500 in mid-2026, is the index level. It is not a price in dollars. It is a running score calculated from the share prices and sizes of all 500 companies. When traders say the S&P 500 is "at 7,500", they mean the index reading, and their profit or loss is tied to how that reading moves.
How the S&P 500 is put together
The index is not a simple average. If it were, a $3 stock would count as much as a $3 trillion company. Instead, bigger companies carry more weight. Understanding this is the difference between knowing what you are trading and guessing.
Why the biggest companies move the index most
The S&P 500 is weighted by float-adjusted market capitalisation. In plain terms, each company's slice of the index is set by its market value: the share price multiplied by the number of shares available to trade. A company worth $3 trillion moves the index far more than one worth $30 billion, even though both are "one of 500".
This has a practical result you need to know as a trader. A handful of giant technology companies now drive most of the index's movement. On any given day, the S&P 500 can rise or fall largely because of what happens to a few names at the top.
The top 10 companies and why concentration matters
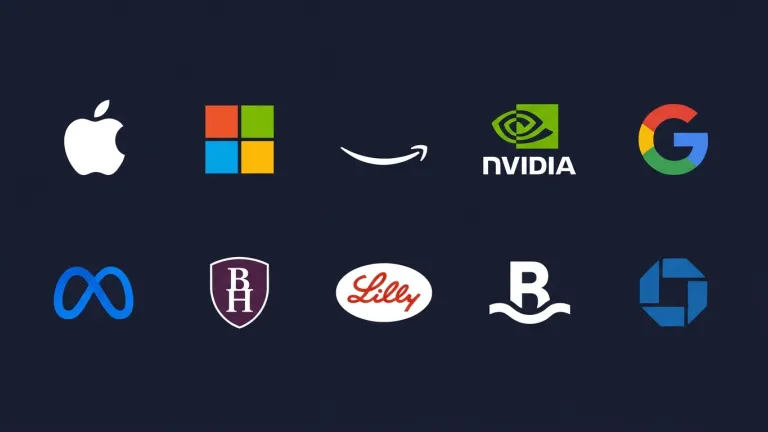
As of 2026, Nvidia is the largest company in the index at roughly 7% of its total weight, followed by Apple near 6% and Microsoft around 5%. Those three alone account for close to a fifth of the entire index.
The top 10 companies together make up about 39% of the index, the highest concentration on record.
Why should a beginner care? Because "buying the S&P 500" is often sold as buying 500 companies for safety. In reality, a big chunk of your exposure sits in technology and a few mega-cap names. When those names have a bad week, the whole index feels it, no matter how well the other 490 are doing.
S&P 500 breakdown
| Rank | Company | Weight |
|---|---|---|
1 | Nvidia | 7% |
2 | Apple | 6.3% |
3 | Microsoft | 4.6% |
4 | Top 10 combined | 38.7% |
As of June 2026
The 11 sectors inside the index
The 500 companies are grouped into 11 sectors. This is how you tell whether a move is broad or narrow. If only technology is up and the other ten sectors are flat, the rally is thinner than the headline suggests.
- Information Technology
- Communication Services
- Consumer Discretionary
- Consumer Staples
- Financials
- Health Care
- Industrials
- Energy
- Utilities
- Real Estate
- Materials
Information Technology is the heaviest sector by some distance, which is why the index behaves more like a technology bet than most beginners expect.
Who decides what goes in it
The S&P 500 is not automatic. A committee at S&P Dow Jones Indices chooses the members, and companies must clear a set of rules to qualify.
To be eligible, a company must be based in the US with its primary listing on a US exchange, be profitable over its most recent quarter and the sum of the last four quarters, meet a minimum market-value threshold, and have traded publicly for at least 12 months.
The membership is reviewed and rebalanced every quarter, in March, June, September and December. Companies that grow qualify. Companies that shrink or get acquired drop out. The index quietly replaces its losers with winners over time, which is part of why it has trended up over decades.
S&P 500 price history
Why the S&P 500 matters to traders
Three things make the S&P 500 a popular market to trade:
- it moves enough to be worth trading
- it is deep enough to get in and out easily
- its long history gives you context for what you are looking at
Over the long run, the index has returned roughly 10% a year on average since 1957, with dividends reinvested.
That figure gets quoted a lot, usually to sell people on investing. As a trader, treat it with caution. It is a long-term average smoothed over almost 70 years. It says nothing about what happens next week, and it hides some brutal years.
The drawdowns nobody puts on the poster
In 2008, the S&P 500 fell about 38% in a single year, its worst on record.
Measured from peak to trough, the 2008 financial crisis wiped out around 57% of the index's value. The dot-com crash of 2000 to 2002 took roughly 49%. The COVID crash in early 2020 cut about 34% in a matter of weeks. In 2022, the index fell into a bear market again and lost close to a fifth of its value over the year.
The average bear market since 1929 has cut the index by about a third and lasted close to ten months. This is the other side of that comforting 10% average. The index goes up over decades, but it gets there through periods that can and do destroy unprepared accounts.
For a trader, that is not a reason to stay away. Volatility is where the opportunity is. It is a reason to respect the market and size your positions for the bad days, not the good ones.
How to trade the S&P 500
You cannot buy the index directly, so you trade a product that tracks it. For a beginner, three routes matter. They differ in cost, complexity, and how much money you need to start.
Index funds and ETFs: owning the market
An S&P 500 ETF is a fund that holds all 500 stocks and trades like a single share. You buy it, you own a slice of the index, and you profit if it rises. It is simple, cheap to hold, and the standard choice for long-term investing rather than active trading. The catch for a trader: you only make money when the index goes up, you need the full value of what you buy, and you cannot easily profit from a falling market.
Futures: the professional route
S&P 500 futures are contracts to trade the index at a set price on a future date. They are highly liquid and trade nearly around the clock, which is why professionals use them. They are also large, complex, and unforgiving for beginners. Contract sizes and margin requirements are steep, and a small mistake gets expensive fast. This is not where most people should start.
CFDs: the flexible route for active traders
A CFD, or contract for difference, lets you trade on the index's price movement without owning anything.
You can go long if you think it will rise or short if you think it will fall. You put down a fraction of the position's value as margin, which means a smaller account can trade a meaningful position. That flexibility is why CFDs are the most relevant route for active retail traders, and it is what the next section covers in full.
Ways of trading the S&P 500
| Method | Best for | Watch out for |
|---|---|---|
ETF / Index Fund | Long-term investing, buy and hold | ETF / index fund Long-term investing, buy and hold Long only, needs full capital, slow to trade |
Futures | Experienced, well-capitalised traders | Large contracts, complex, high risk |
CFD | CFD Active retail traders, long or short Leverage magnifies losses, ongoing costs | Leverage magnifies losses, ongoing costs |
Trading the S&P 500 as a CFD
This is the route most active retail traders use, so it is worth understanding properly before you risk a cent. A CFD is simple in principle and easy to misuse in practice. Get the mechanics right and the rest follows.
What a CFD actually is
A contract for difference is an agreement between you and your broker to exchange the difference in the index's price between the moment you open the trade and the moment you close it.
If you open a long position at 7,500 and close it at 7,600, the broker pays you the 100-point difference, multiplied by your position size. If you got the direction wrong and it falls to 7,400, you pay the difference instead. You never own any shares. You are trading the movement, nothing more.
Because you can bet on a fall as easily as a rise, CFDs let you try to profit whether the market goes up or down. That is the main appeal over simply owning a fund.
Going long and going short
Long means you buy first, expecting the price to rise, and sell later to close. Short means you sell first, expecting the price to fall, and buy back later to close.
Shorting confuses beginners because you are selling something you do not own. With a CFD you can, because you are not trading the shares, only the price difference. If the index drops after you short it, you profit. If it rises, you lose. It is the mirror image of going long.
Margin and leverage: the part that makes or breaks you
This is the single most important idea in CFD trading. Get it wrong and nothing else matters.
When you open a CFD, you do not pay the full value of the position. You put down a deposit called margin, and the broker covers the rest. The full position size is your exposure. The margin is just the slice you post to hold it.
For major stock indices, retail margin is commonly around 5%, which corresponds to leverage of about 20 times. Exact figures vary by broker and by regulator. (ESMA)
Leverage is a magnifier. A 5% margin means every 1% the index moves is a 20% move on your deposit. That cuts both ways. A move in your favour is amplified. A move against you is amplified just as hard, and it eats your margin fast.
A worked example: one long trade, start to finish
Numbers make this concrete. The figures below are illustrative and rounded to keep the maths clean. Real spreads, margin rates and financing costs vary by broker, so check yours before trading.
Assume the S&P 500 CFD is priced at the index level, and you trade at $1 per point per contract.
Opening the trade
- You expect the index to rise. You buy 1 contract at 7,500.
- Position size (exposure): 7,500 points x $1 = $7,500.
- Margin at 5%: you only put down $375 to hold that $7,500 position.
- Spread cost: if the broker's spread is 0.4 points, you pay about $0.40 to enter. Small here, but it adds up across many trades.
If the trade goes your way
The index rises to 7,600. That is a 100-point move in your favour.
- Profit: 100 points x $1 = $100.
- Return on your $375 margin: about 27%, from a move of just 1.3% in the index.
That is leverage working for you. A small index move became a large percentage gain on your deposit.
If the trade goes against you
Now run it the other way. The index falls to 7,400. That is a 100-point move against you.
- Loss: 100 points x $1 = $100.
- That is roughly 27% of your margin gone from the same 1.3% index move.
Same size move, same magnifier, opposite result. If the index fell far enough, your loss could exceed the $375 you posted, which is why the next two points matter.
The costs that run in the background
Hold a CFD overnight and you pay a financing charge, often called swap or overnight funding. It is the daily interest cost of the money the broker is effectively lending you to hold a leveraged position, and on a long index position it is usually a charge rather than a credit. (IG)
For a day trade, financing is irrelevant. Hold a position for weeks and it becomes a real cost that quietly eats your profit. Factor it in before you plan to hold anything for more than a day or two.
The protections worth knowing about
Regulated brokers typically offer two safeguards for retail traders. A margin close-out rule automatically closes your positions if your account falls below a set level, often 50% of required margin, before losses run deeper. And negative balance protection caps your loss at the money in your account, so you cannot end up owing the broker more than you deposited.
These are safety nets, not strategies. They stop a disaster from becoming a catastrophe. They do not stop you losing the money in your account. That job is yours, and it is what risk management is for.
Popular strategies for beginners
You do not need a complicated system to start. You need one simple approach you understand and can follow. Here are three that beginners actually use, and the one force that moves the index more than any chart pattern.
Trend following: trade with the tide
The oldest idea in trading. If the index has been rising over recent weeks, you look for chances to go long. If it has been falling, you look to go short or stay out. You are not predicting a turn, you are riding the direction that already exists.
A common beginner version: only take long trades when the price is above its 50-day moving average, and only shorts when it is below. It keeps you on the side of the prevailing move, which is where the odds sit.
Breakout trading: trade the escape
Markets often trade sideways in a range, then break out sharply. Breakout traders wait for the index to push clearly above a recent high or below a recent low, then trade in the direction of the break. The logic: a decisive break often signals a new move starting. The risk: false breakouts that snap back, which is why a stop-loss is not optional here.
Buying the dip: trade the pullback
In a longer uptrend, the index rarely rises in a straight line. It rises, pulls back, and rises again. Dip buyers wait for a pause or a small drop within an uptrend, then go long, betting the trend resumes. The danger is obvious: not every dip is a dip. Some are the start of a proper fall. That is why dip buyers set a level where they admit they were wrong and get out.
What actually moves the index
Charts show you what happened. News is what makes it happen. The S&P 500 moves hardest around a few scheduled events, and a beginner who ignores them gets blindsided.
- Central bank interest-rate decisions, which reprice the whole market at once.
- Inflation and jobs data, which shape what the central bank does next.
- Earnings season, when the biggest companies report and the top-heavy index reacts to a handful of results.
You do not need to trade these events. Early on, it is often smarter to stand aside during them. But you should always know when they are due, because that is when the sharp moves come.
Managing your risk
Beginners think trading is about being right. It is not. It is about surviving being wrong, because you will be wrong often. The traders who last are not the ones who pick the most winners. They are the ones who lose small when they are wrong.
Here are a few tips for how you can protect yourself.
Risk a fixed, small slice per trade
The core rule: never risk more than 1% to 2% of your account on a single trade. On a $2,000 account, that is $20 to $40 of risk per trade. It sounds too cautious to a beginner who wants fast gains. It is exactly why experienced traders are still trading and most beginners are not. A run of losses cannot wipe you out if each loss is tiny.
Always use a stop-loss
A stop-loss is an order that closes your trade automatically if the price hits a level you set in advance. You decide your maximum loss before you enter, not in the panic of watching it fall.
Without a stop, a losing trade has no floor. Traders talk themselves into holding, sure it will come back, and a small loss becomes an account-ending one. The stop takes that decision out of your hands. Set it when you open the trade, every time.
Size your position from your stop, not your hope
Position sizing ties the last two rules together. Once you know how much you will risk and where your stop sits, the size of your trade is a calculation, not a feeling.
- Decide your risk in money. On a $2,000 account risking 1%, that is $20.
- Measure your stop distance in points. Say you will exit if the index moves 40 points against you.
- Size so that 40 points equals $20. At $1 per point that is too big, so you trade a smaller size, for example $0.50 per point, making your risk $20.
Do this and every trade risks the same small amount, no matter how far away your stop is. That consistency is what a trading plan is made of.
Respect leverage instead of chasing it
High leverage is sold as opportunity. Treat it as a risk to be managed. The fact that you can control a $7,500 position with $375 does not mean you should max it out. Trade smaller than you are allowed to. The traders who survive their first year are almost always the ones who used far less leverage than their broker offered.
Common beginner mistakes
Most beginners lose money the same handful of ways. Knowing them in advance is half the battle.
- Overleveraging. Trading the biggest position the margin allows, so one normal move against you does serious damage.
- Trading without a stop-loss. Hoping a losing trade recovers instead of accepting a small, planned loss.
- Revenge trading. Taking a bigger, worse trade straight after a loss to "win it back". This is how a bad day becomes a bad month.
- Ignoring costs. Forgetting that spreads and overnight financing quietly erode returns, especially on positions held for days.
- No plan. Trading on feeling, tips, or a finfluencer's screenshot, with no rule for when to enter, exit, or walk away.
- None of these are about intelligence. They are about discipline. The market punishes the same lapses in everyone.
The bottom line
You now know what the S&P 500 is, how it is built, how to trade it as a CFD, and the risk rules that decide whether you last. The mechanics are simple. The discipline is the hard part.
The best next step is not a bigger trade. It is a demo account, where you practise placing trades, setting stops, and sizing positions with no money on the line until the process feels automatic.
Open a demo account and place your first practice trade on the S&P 500 today.
Frequently asked questions
Not directly. The S&P 500 is an index, a measurement, not a security. You buy a product that tracks it, such as an ETF, a futures contract, or a CFD. Each gives you exposure to the index's movement in a different way.
Less than most people think, because CFDs use margin. A small S&P 500 CFD position might need only a few hundred dollars in margin. That said, starting small is about learning, not earning. Trade a size where a loss teaches you something rather than hurting you.
Yes. CFDs are leveraged, so losses can build quickly, and most retail CFD accounts lose money. The risk is manageable with strict position sizing and a stop-loss on every trade, but it is real and should not be underestimated.
The S&P 500 is the index itself, the underlying measurement. An S&P 500 ETF is an investable fund that holds the 500 stocks and aims to track that index. You can buy the ETF. You cannot buy the index.
Yes, easily, with a CFD. Going short means you profit if the index falls. You sell to open and buy back to close. It is the mirror of going long, and it is why traders use CFDs to trade both rising and falling markets.
The most active hours are during the US cash session, when the underlying market is open and liquidity is deepest. Beginners often avoid the minutes around major news releases and earnings, when moves are sharp and spreads can widen. Knowing when those events land matters more than any single time of day.